|
Recently, a spate of findings and ratings has been released by the San Francisco Controller’s Office and the Trust for Public Land, measuring the performance of city departments and quality of life issues.
SF Controller’s Office 2019 City Survey Report
This month, the Controller’s Office came out with its biennial (2019) City Survey Report for FY 2018. On average, City service ratings have changed very little since 2017.
SF Recreation and Park’s score rose to a B+ rating from last year. The quality of fields and courts for the parks system represents the largest improvement, increasing by 9 points. Most individual Muni attributes (safety, cleanliness, frequency and reliability) have lower ratings.The overall Muni rating has seen the largest decrease, 19 percent. Here are some major findings.
Government: B- The percent of respondents rating government A or B falls below 50% for the first time since 2011. Homelessness remains the top issue among respondents, and three-quarters believe it has gotten worse. A quarter of respondents cite infrastructure as a top issue and over half believe street cleanliness has declined. One-fifth of respondents cite law enforcement and safety as a top issue, while just under half believe public safety has gotten worse. Libraries: A- Library ratings reach an all-time high, with the highest grade of any service since the first City Survey in 1996. 93% of respondents rate assistance from library staff an “A” or “B,” the highest of the survey. Parks: B+ Four of the five park attributes increased from 2017 (landscaping, recreation centers, programs and activities, athletic fields and courts); only park cleanliness remains essentially unchanged. (See results for Glen Canyon Park below.) Safety: B Most respondents (85%) report feeling safe or very safe walking alone in their neighborhood during the day, while just over half (53%) report feeling safe or very safe walking alone in their neighborhood at night. Gender continues to be a key factor in feelings of safety. Sixty-one percent of male respondents report feeling safe or very safe at night; only 44% of female respondents report the same. Transportation: C+ Respondent ratings of the courtesy of drivers remains the highest rated of Muni attributes, and the only one to increase from 2017. Of all ratings in the 2019 City Survey, Muni’s ability to manage crowding receives the lowest rating, Infrastructure: B- Quality of water services is the only infrastructure attribute with a letter grade improvement, from B+ to A-. Respondents rate the quality of water services the highest (87% rating an “A” or “B”) and street and sidewalk cleanliness the lowest. 311 Services: B+ Ratings of 311 experiences are almost identical to 2017 levels. Among those who had heard of 311, about half used 311 services in the past year. The overall findings of the report are further refined by district, race/ethnicity, socioeconomic status, and age. The full report can be found here. The Trust for Public Land’s City Park Scores The Trust for Public Land has released its 8th annual ParkScore index for cities nationwide. This measure is touted as the most comprehensive evaluation of park access and quality in the 100 largest U.S. cities. San Francisco ranks 7th in the top 12 nationwide, with Washington, DC #1 and Madison, Wisconsin #12. The city scored 100/100 for both investment and accessibility in our parks. One hundred percent of residents live within a ten-minute walk to a park, versus 54% nationwide. San Francisco is in the 96th percentile for dog parks, with 4.2 per 100,000 people. Check out the San Francisco report here. 
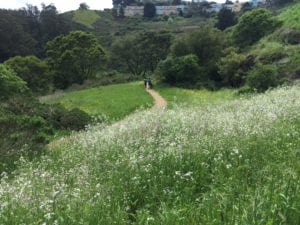
To drill down on what we’re most interested in, namely, how Glen Canyon Park measures up, we go back to the Controller’s City Survey Report. (Dorothy Erskine Park and Billy Goat Hill were not rated.) Glen Canyon Park scored a perfect 100 in lawns, greenspace, ornamental beds and trees. Restrooms came in at an impressive and most welcome 98. The lowest score was for children’s play area, at 85, which seems baffling. Other measures are outdoor courts, 99; hardscape, 97; athletic fields, 96; buildings and general amenities, 95; and table seating areas, 92. Glen Canyon Park exceeded the citywide average in all categories. To study the results, click here. click the Park Lookup tab and enter “Glen Park” in the Search box.
|
|